Chapter 4. Dynamic Binding
Using WebView Scripting, it is possible to dynamically bind DataHub points to symbols and controls, and use these capabilities to make template pages.
4.1. Dynamic Point Binding
Dynamic point binding allows you to change the DataHub points associated with a control at run time. This tutorial shows two different ways to do this (simple array and dynamic list), using two controls - ComboBox and ListBox.
4.1.1. Combo Box control
Start the DataPid program from the Windows menu, the command line, or by clicking on the desktop icon.
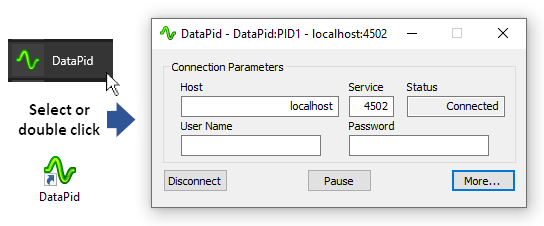
As soon as DataPid starts, it attempts to connect to a DataHub instance and begins generating data.
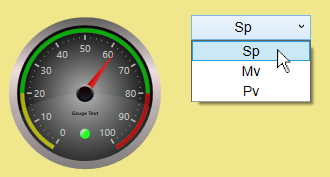
Open the WebView application, open a new page, and add a ComboBox control
 to the page.
 In the Basic Properties of the Combo Box, for the Items Source, select the Script binding type and edit the default script to read:
["Sp", "Mv", "Pv"];
Then press the button.
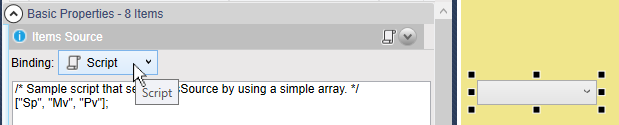
In this line of script, the
[and]characters tells the WebView scripting engine that this is an array of comma-separated strings, each of which should be assigned to one value in the Combo Box control.![[Note]](images/note_1156523861.png)
As an alternative to using an array, it is possible to use a script to list the items, as explained in the List Box control section, below.
Add a Circular Gauge 2 control
 to the page.
In the Basic Properties of the Circular Gauge 2, for the Current Value, select the Point binding type and make a script:
="DataPid:PID1." + GETP("ComboBox1@SelectedValue");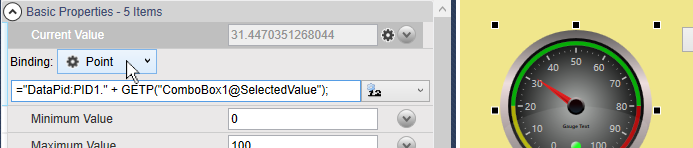
When a line of script is entered as a point binding as we see here, the
=sign tells the WebView scripting engine that the point name will be assigned. In this example, this allows the name of the point to be constructed by concatenating strings. TheGETPfunction gets the property of a control. The syntax for theGETPargument is a string consisting of the name of the control, an@symbol, and the name of the parameter that you need to get.Switch to Run mode and choose selections from the Combo Box and see the results in the Circular Gauge.
4.1.2. List Box control
Ensure that the DataPid program is running, or start it from the Windows menu, the command line, or by clicking on the desktop icon.
Open the WebView application, open a new page, and add a List Box control
 to the page.
In the Basic Properties of the List Box, for the Items Source, select the Script binding type and edit the default script to read:
var pts = new List<|string|>();
pts.Add("Mv");
pts.Add("Pv");
/* More strings can be added ... */
pts;
Then press the button.
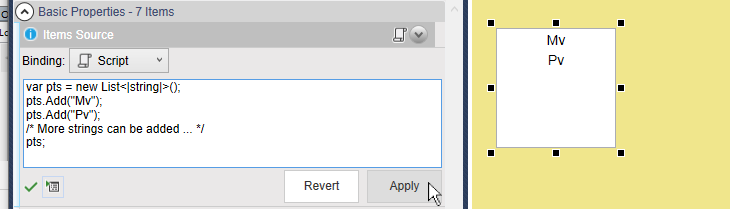
This example script creates a list of strings, and then adds two strings (point names in this case) to the list. The list can hold any number of strings. The final line of the script calls the
pts;variable, which causes the list of strings to be passed to the List Box as its source of items.As an alternative to using a script, it is possible to use a an array to list the items, as explained in the Combo Box control section, above.
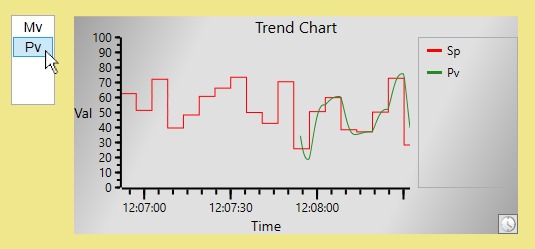
Add a Trend Chart (3 pens) control
 to the page.
In the Basic Properties of the Trend Chart control, for the Pen 1 Value, select the Point binding type enter the value
DataPid:PID1.Sp.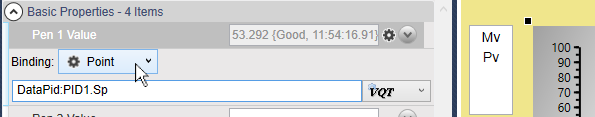
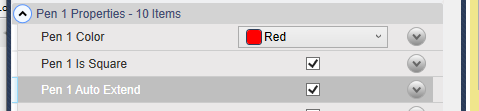
In the Pen 1 Properties of the Trend Chart control, check the Pen 1 is Square and Pen 1 Auto Extend to make the plot more accurate.
For the Pen 2 Value, select the Point binding type and make a script:
="DataPid:PID1." + GETP("ListBox1@SelectedValue");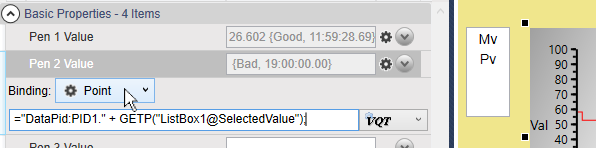
Switch to Run mode and choose selections from the List Box and see the results in the Trend Chart.