The visibility of the Debug Window can be toggled by using the application menu (Tools | Diagnostics | Show Script Debug Window) or the toolbar button. The Debug Window is available in Design Mode and Run Mode (subject to permissions), but not in Kiosk View.
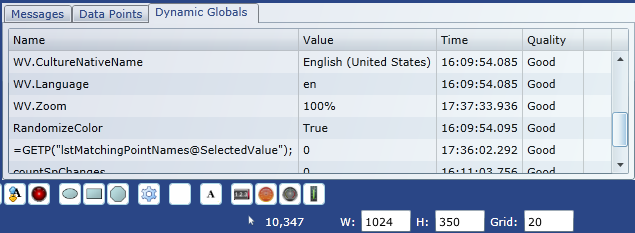
The Debug Window contains three tabs: Messages, Data Points and Dynamic Globals.
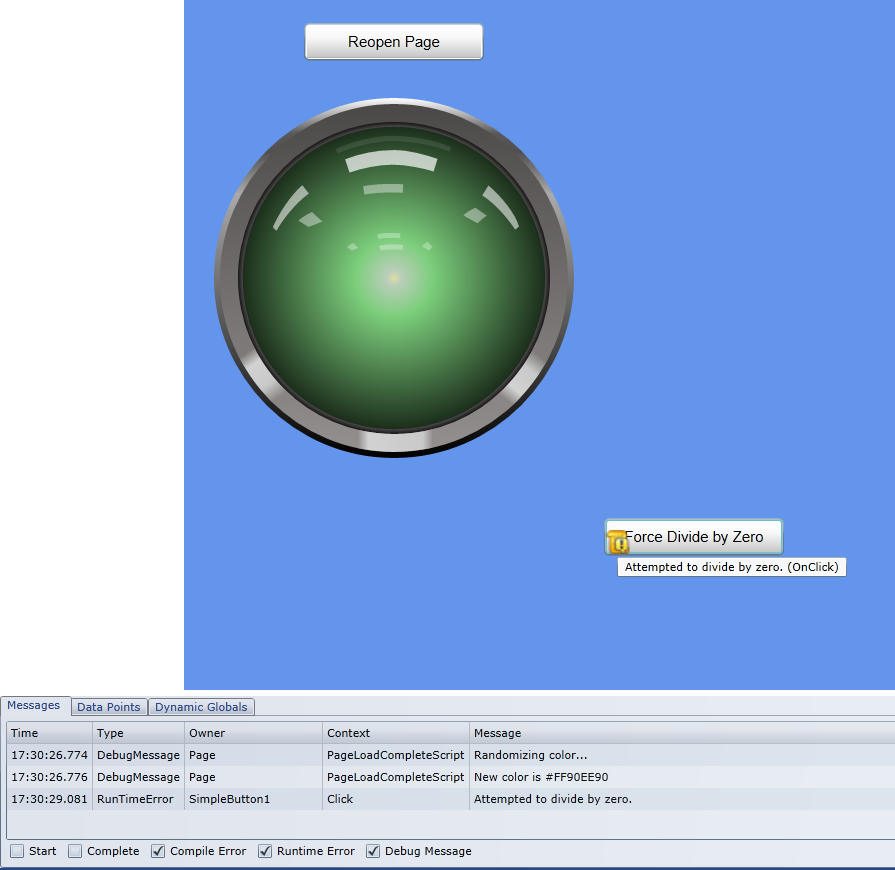
Debug Window showing Messages
Most messages are automatically directed to the window when the application detects compile and runtime errors. However, you can also use the DEBUG function in any script expression to emit your own messages. These messages can be very helpful when trying to troubleshoot logic and timing problems.
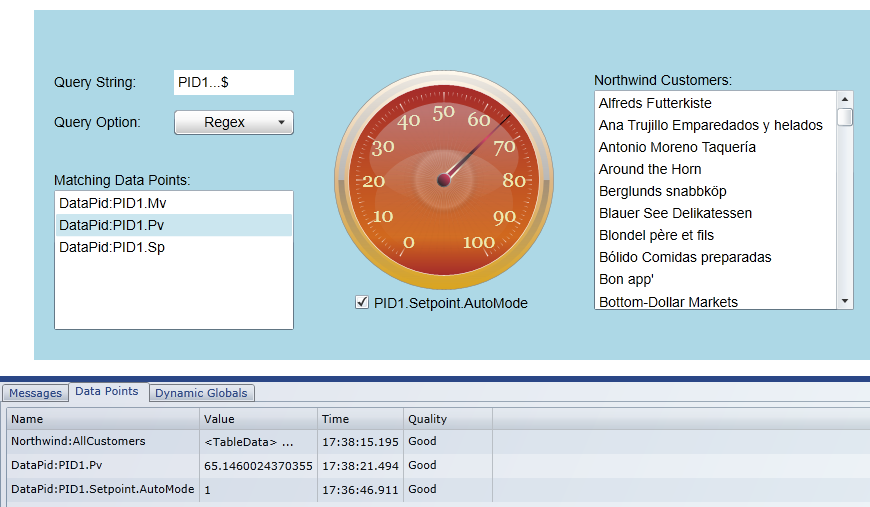
Debug Window showing Data Points
The Data Points tab lists all data points currently in use as Point Bindings.
Name, Value, Time and Quality are shown for each data point (see _members--#p:IVqt properties).
As bindings change (including Dynamic Point Bindings), the list is automatically updated.
At a glance, you can see all data points used by your page elements. The image (below) shows a gauge bound to DataPid:PID1.Pv,
a checkbox bound to DataPid:PID1.Setpoint.AutoMode and a listbox bound to Northwind:AllCustomers, which is tabular data
(see IDataTable).
Debug Window showing Dynamic Globals
The Dynamic Globals tab lists global variables and script cookies. These items can be accessed in script just like DataHub data points (see Working with Data Points); however, they are managed locally by the WebView client, and therefore are not shared with other users.