3.17. InfluxDB

|
The InfluxDB option lets you run InfluxDB, an open-source time-series data historian that is offered as a plug-in for the DataHub program. The DataHub implementation of InfluxDB includes Grafana, an open source analytics and monitoring tool that can be configured to work with InfluxDB, along with Chronograf, the InfluxDB dashboard. |
InfluxDB requires a 64-bit operating system. The DataHub installation of InfluxDB is version 1.x. InfluxDB 2.0 is supported, but must be installed separately. To use your own version of InfluxDB 1.x or 2.0, you should ignore the Configuration options below, and run your own installation. See also Connecting to InfluxDB , External Historian, and Advanced Topics for additional helpful information.
![[Important]](images/important_2051192373.png) | |
If you install InfluxDB separately, do not put it in the same folder as the DataHub installation. Otherwise your version of InfluxDB will be replaced by the DataHub installer whenever it runs, and your database and files will get overwritten. |
Server Control
Here you can start up, configure, and access the three InfluxDB components.

The DataHub program is pre-configured for InfluxDB and its components. Click the check-box and press to start any of them. The status should change to Starting, and then to Running.
See Connecting to InfluxDB to get started with InfluxDB, or go to the External Historian section for more details on configuring a data connection to your InfluxDB database. Additionally, the Advanced Topics provide more information about accessing data written by other applications, which fields and tags are used, and the index field and multiple data sources.
If you need to edit the configuration of any component, click the button to open the Configure Server window for InfluxDB, Grafana, or Chronograf.
3.17.1. Configuration
This is the Configure Server window for the InfluxDB program itself. Generally, if you do not know what a setting is for, you do not need to change it.
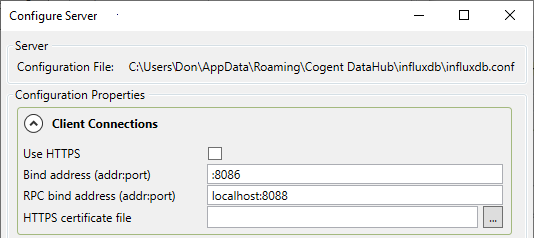
Client Connections
- Use HTTPS
If selected, the server will listen for connections as HTTPS instead of HTTP. Use this if security is more important than speed. The client applications will need to use this protocol to connect to this InfluxDB server.
- Bind address (addr:port)
Specify a port for the server to listen on (either HTTP or HTTPS). InfluxDB allows you to limit which network interfaces to listen on, as well as the port number. The default value is
:8086. The special syntax:1234indicates to listen on all network interfaces.- RPC bind address (addr:port)
The address to bind for backup and restore services. A DataHub instance does not use this address, but allows you to set it for your own purposes. For example,
0.0.0.0:8088would allow connections on any network interface, while127.0.0.1:8088would allow connections only from the local computer.- HTTPS certificate file
Enter the location of the SSL certificate if you have chosen to use HTTPS. This should be a file in PEM format, including the private key.
File Paths

You can set the file path to the InfluxDB database on disk. The string
{config} will be replaced with the DataHub configuration
folder, and {install} with the DataHub installation folder.
Normally the data, metadata, and WAL folders should be placed within the same
parent folder.
General
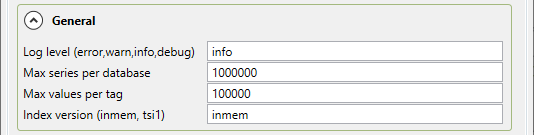
- Log level
Specify the severity level of messages that the InfluxDB server should write to its log file.
- Max series per database
The maximum number of InfluxDB series this database will allow. A series is effectively a DataHub data point, so this setting limits the maximum number of data points (different data point names) that can be stored.
- Max values per tag
The maximum number of unique values that a tag can have within the database. Since the data point name is stored as an InfluxDB tag, this setting also sets a maximum on the number of data points that can be stored. In effect, the maximum number of data points (distinct data point names) that can be stored is the smaller of Max series per database and Max values per tag.