3.17.2. Grafana
This is the Configure Server window for Grafana, the analytics and monitoring tool that works with InfluxDB:
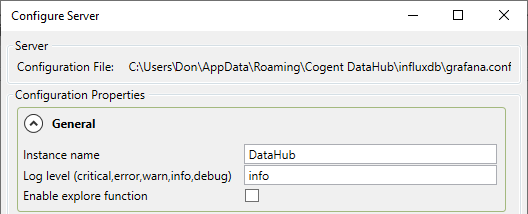
General
- Instance name
You can change the default name,
DataHub, to any other name.- Log level (critical, error, warn, info, debug)
Specifies the severity level of messages that Grafana should write to its log file.
- Enable explore function
Enables the Grafana explore function. See https://grafana.com/docs/features/explore/ for more information.
File Paths
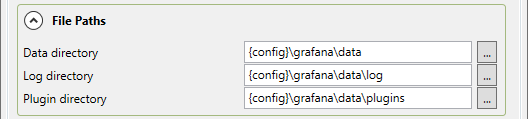
Set the file locations for the Grafana data, log and plugin folders. The
string {config} will be replaced with the dh; configuration
folder, and {install} with the DataHub installation folder.
Normally these folders should be placed within the same parent folder.
Client Connections
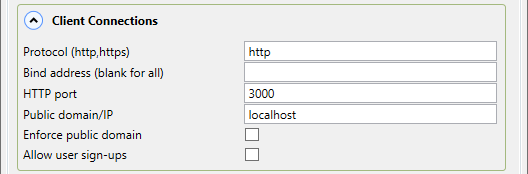
- Protocol (http, https)
Enter the protocol that you want Grafana to support.
- Bind address (blank for all)
Grafana will listen on only the address specified here, or on all addresses if this is left blank.
- HTTP port
The port for the HTTP or HTTPS clients to connect.
- Public domain/IP
The public domain name or IP address of this Grafana server. See https://grafana.com/docs/installation/configuration/#domain for more information.
- Enforce public domain
Enforces the use of the public domain. See https://grafana.com/docs/installation/configuration/#enforce-domain for more information.
- Allow user sign-ups
Checking this box allows users to sign up for an account, and create their own user names and passwords. If this box is not checked then the Grafana administrator must create new user accounts.
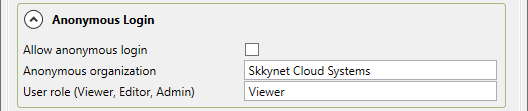
Anonymous Login
Enter the appropriate information for the email account that Grafana will use for sending out emails. See https://grafana.com/docs/installation/configuration/#smtp for more information.
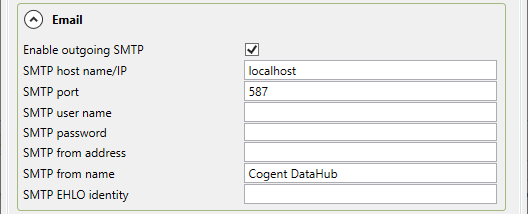
Enter the appropriate information for the email account that Grafana will use for sending out emails. See https://grafana.com/docs/installation/configuration/#smtp for more information.
Security
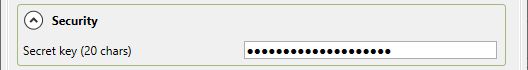
Enter the appropriate information for the email account that Grafana will use for sending out emails. See https://grafana.com/docs/installation/configuration/#smtp for more information.