2.10.2. Tools
These troubleshooting tools are all available from the DataHub Properties window, typically used in this order for troubleshooting:
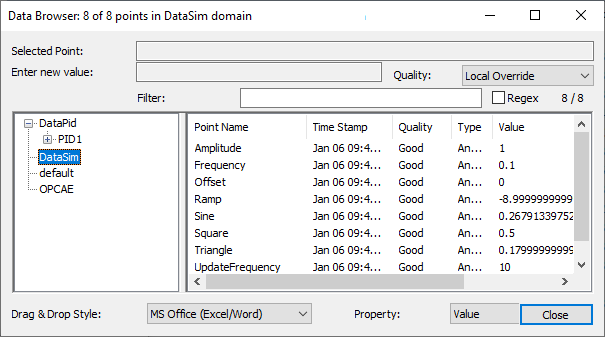
Data Browser: Use the button to open the Data Browser to get a general overview of your data. You can check current values, timestamps and quality for all points, and confirm that the quality and data updates are as expected.
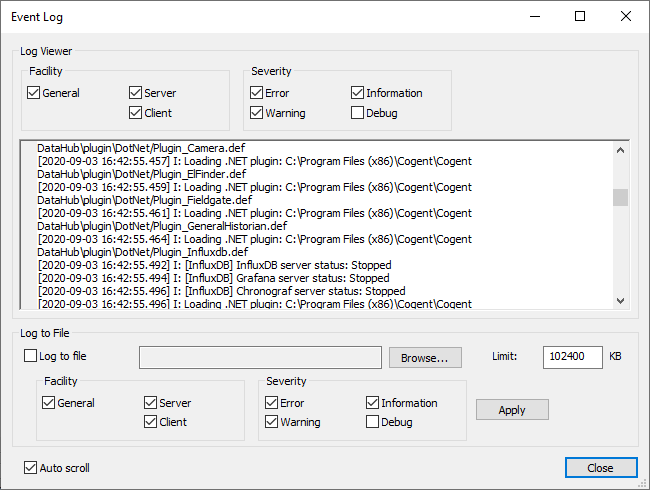
Event Log: The best place to root out problems is the Event Log. If you need help understanding the output, you should contact Cogent. If you do, you should include the relevant Event Log output—as a screen shot if it is very short, or by enabling and zipping up the results. You can also check the options for detailed debugging information, keeping in mind that this will slow down logging and create large files. Be sure to uncheck it when done troubleshooting.
Connection Viewer: To troubleshoot connectivity, use the Connection Viewer. Here you can see data point change rates, confirm connections, and monitor possible CPU overload.

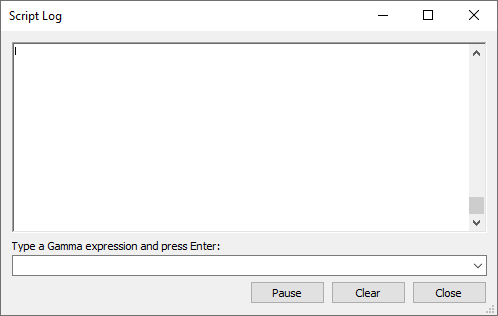
Script Log: If you are doing DataHub scripting, you can use the Script Log to view output from scripts, and interact with the Gamma scripting engine. You will also find troubleshooting information here for the DataHub Database (logging) feature.
All of these tools, and particularly the Event Log, are useful for reporting problems.