4.3. Creating a Template Page
This tutorial shows how to create a page where you can switch between data sources in a single display, at the click of a button.
With DataPid running, start another instance of DataPid. In the second DataPid instance, click the button to expose the DataPid Configurable Options
Change the Domain to
OtherPidand click the button. Then press the button.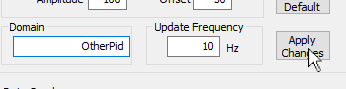
If you look in the DataHub Data Browser, you should see a new data domain,
OtherPidwith data changing values.Go to the option of the DataHub Properties window, and in the Data Domains Visible to WebView section, click the button.
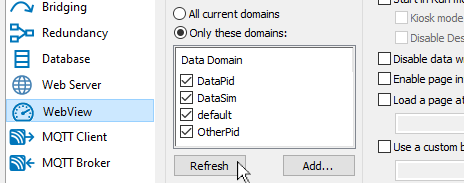
The domain name
OtherPidshould appear in the list. Check the checkbox to make the OtherPid domain visible to the WebView application, and make its points accessible. Now we have two identical point sets with different data to demonstrate our template page.
Restart the WebView application if it is already running, for the changes to take effect. Open a new page, and add a Combo Box control
 to the page
In the Basic Properties of the Combo Box, for the Items Source, select the Script binding type and edit the default script to read:
["DataPid", "OtherPid"];

Add a Point Data Table control
 to the page.
 In the Basic Properties of the Point Data Table, for the Point Pattern, select the Script binding type and edit the default script to read:
"^" + GETP("ComboBox1@SelectedValue") + ":PID1." + "..$";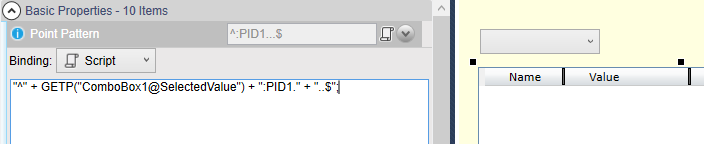
The
^symbol allows any combination of prefix characters, while theGETPexpression pulls in the value from the ComboBox. The..$string allows for any combination of suffix characters after the requiredPID1.string.In the Columns Visibility property, change the Domain Names entry from Collapsed to Visible.

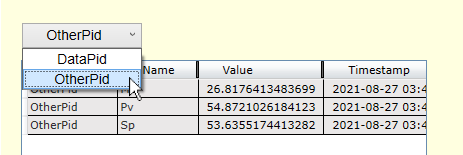
Switch to Run mode and change the data domain in the Combo Box from DataPid to OtherPid to view the two different sets of data points.
Add a Trend Chart (3 pens) control
 to the page.
In the Basic Properties of the Trend Chart, for the Pen 1 Value, select the Point binding type and enter:
=GETP("ComboBox1@SelectedValue") + ":PID1.Sp";![[Note]](images/note_1156523861.png)
When a line of script is entered as a point binding as we see here, the
=sign tells the WebView scripting engine that the point name will be assigned. In this example, this allows the name of the point to be constructed by concatenating strings. TheGETPfunction gets the property of a control. The syntax for theGETPargument is a string consisting of the name of the control, an@symbol, and the name of the parameter that you need to get.To give a better shape to the trend line for the Sp point, in the Pen1 Properties check the boxes for the Pen 1 Is Square and the Pen 1 Auto Extend options.
Back in the Basic Properties, for the Pen 2 Value select the Point binding type and enter:
=GETP("ComboBox1@SelectedValue") + ":PID1.Mv";And for the Pen 3 Value select the Point binding type and enter:
=GETP("ComboBox1@SelectedValue") + ":PID1.Pv";You should now see all three trends.
Switch to Run mode, and again change the data domain in the Combo Box from DataPid to OtherPid. Now both the table and the trend chart alternate between the two different sets of data points.
Following this example, you can build a page to display multiple identical sets of data in any group of controls. with the ability to switch between data sets at the click of a button.