3.16.3.6. InfluxDB V1
From the Edit Historian Connection window you can select InfluxDB.
Connection Settings

- Label
A unique text string used to identify this connection. This label is used to identify the connection when configuring store and forward, and to create the database name or retention policy in some historians, like InfluxDB. The label can contain only letters, numbers and the underscore (
_) character.- InfluxDB URL
The URL for the InfluxDB database.
- Database name
The name configured in the DataHub instance for the configured InfluxDB instance.
- Retention Policy
The name of the InfluxDB retention policy to use. If it does not exist, the DataHub instance will create it. If this is left blank, the connection label will be used as the retention policy name.
- Measurement Name
The InfluxDB measurement name to use. If it does not exist, the DataHub instance will create it. If this is left blank, a measurement name of
DataPointswill be used.- User name
The user name for the configured InfluxDB instance.
- Password
The password associated with the User name.
- Accumulation time (ms)
The number of milliseconds that the DataHub instance will buffer data in memory before sending it to InfluxDB. Setting this value to zero means that no accumulation time will be enforced.
![[Note]](images/note_1156523861.png)
The DataHub instance writes data by batches to InfluxDB. You can change the batching behaviour with these settings. If both this value and Maximum # of buffered values (below) are specified, then the DataHub instance will write all buffered values to InfluxDB whenever the first of these two limits is reached.
- Maximum # of buffered values
The maximum number of values that the DataHub instance will buffer in memory before transmitting them to InfluxDB. Setting this value to zero means that no values will be buffered.
- Read-only - do not write to database
Prevents the DataHub instance from writing to the InfluxDB data set.
- Log writes at information level
Checking this option causes messages regarding successful writes to the database to be logged at the level in the DataHub Event Log. If this is not checked then these messages are logged at the level and are therefore normally hidden from the user.
Retention Settings
How much and how long the data is retained in InfluxDB.

The DataHub instance creates its own database and retention policy to store
the information it collects. If the database already exists, the DataHub
instance will use it. The DataHub instance will create a retention policy named
database_name.labeldatabaselabel
You can set the retention disk limit to 0 to disable it
and let the disk space grow indefinitely. If the limit is set to a non-zero
number, The DataHub instance will estimate the disk usage for the data and
attempt to delete data over time to keep the disk usage close to that
number. This estimate is not exact, as InfluxDB compresses data on disk and
may wait for some time after data is deleted before removing it from disk.
Do not set a disk limit that would be close to the actual free disk space
available.
You can set the retention time to any number of days from
0.042 (about 1 hour) to 1491308.
If you set the retention time to 0, the retention time
will be infinite.
- Disk limit (MB)
The disk space in megabytes allotted to storing historical data.
- Retention time (days)
The number of days that data will be retained. Data older than this limit will be deleted daily.
Modify Point Names, Data Sampling and Forwarding
Please see Modify Point Names, Data Sampling or Forwarding in Connection Configuration for how to configure these options.
View Data
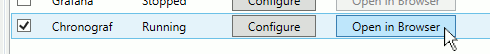
You can view updates to the InflluxDB database in Chronograf.
Ensure that both InfluxDB and Chronograf are running, and click the Chronograf button.
Go to Dashboards and click , then .
Choose the database you have configured, and the points you want to display in DataPoints, under pointname.
Turn on for displaying multiple points, and under Fields select value.

You should start to see some data appear in the trend at the top of the display. You can change the dashboard name and click the green checkbox to save the dashboard.

Please refer to the Chronograf documentation for more details.
Once you have completed the InfluxDB-specific configuration, you can return to Picking Points in General Options to continue.