2.9. Troubleshooting
2.9.1. Reporting Problems
We have designed DataHub software to be easy to use, but understand that problems can arise. Many can be solved reading the documentation or watching our technical videos, but sometimes more assistance is necessary. We are happy to help.
Before contacting us, please check:
Are you running the latest version of the DataHub software?
Is the DataHub program installed and configured correctly?
Does it run OK?
If you are tunnelling, is your connection to the network and/or Internet up and functioning normally? Do your firewall settings allow the necessary access? Can you ping between machines?
System and Problem Descriptions
If a problem persists, please send the following information to our support team:
A system description including all data connectivity information:
Data communication protocols used (OPC, MQTT, Modbus, etc.)
The number of DataHub instances in use
DataHub features in use at each node
The DataHub version number
A system diagram, if relevant
A problem description, containing as much detail as possible, such as:
When was the problem first noticed?
What kind of action triggers it?
What has changed in the system recently?
How often does it happen?
How to reproduce it?
The DataHub Event Log output. You can copy the text of the log right from the display window, if the whole problem is visible. Otherwise, we recommend selecting and zip up and send the whole file. (See more.)
Screenshots of relevant configuration dialogs to help us locate any configuration problems.
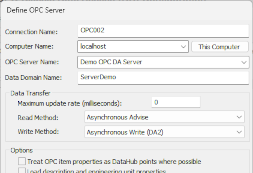
If you have any error messages or related error logs produced by connected software, such as a client program, please include a screenshot or text copy of those messages.
The more complete the information we receive, the easier it is to solve your problem.
Contact Skkynet
Please send all of the above information to [email protected]
Other Useful Information and Tools
Often the information mentioned above is enough to help us to solve the problem. Sometimes we will need more, as listed below. Occasionally it is helpful to view the problem in MS Teams or other desktop sharing application. If that becomes necessary, we will arrange a meeting.
Configuration Directory
Sometimes we will need a copy of the DataHub configuration files. These are all in one directory, located here:
For all recent Windows versions:
C:\Users\UserName\AppData\Roaming\Cogent DataHubFor Windows XP and Windows Server 2003:
C:\Documents and Settings\UserName\Application Data\Cogent DataHubIf necessary, the directory can be zipped up and emailed to us.
Script Log
In addition to the Event Log, another useful DataHub log is the Script Log. This records any errors in DataHub scripts. Also, the Database (ODBC) feature uses DataHub scripting, so any errors connecting to a database will appear in the Script Log as well.
Connected Programs
Screenshots and information about connected programs like OPC servers or database tables can be helpful.
Crash Dumps
Crash dumps are frequently helpful in narrowing down the cause of a crash, allowing us to try to reproduce the problem. Windows can create crash dumps in one of the following locations:
C:\Windows\Minidump
C:\Windows\CrashDumps
C:\Users\UserName\AppData\Local\CrashDumps
C:\ProgramData\Microsoft\Windows\WER\ReportQueue
A full crash dump file will likely be 200 MB or more in size, with the word
CogentDataHub in its name somewhere, and a
.dmp suffix.
If you can find a dump, please ZIP it and send it to us, or put it on a file sharing system where we can download it.
If there is no crash dump, you can set a registry entry to cause Windows to
create one on the next crash by setting DWORD -
HKEY_LOCAL_MACHINE\Software\Microsoft\Windows\Windows Error
Reporting\LocalDumps\DumpType to 2. If this
registry value does not exist then you will need to create it.
Wireshark
For OPC UA and Modbus connections, Wireshark is a very useful tool. It lets you trace the conversation and identify where an error might have occurred. You can download the Wireshark software from here.
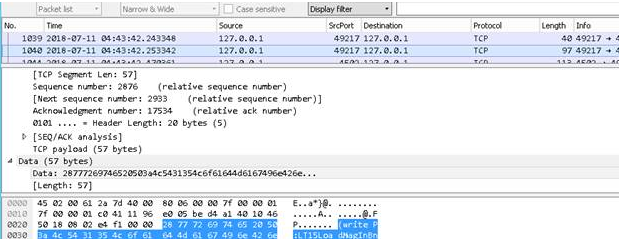
To use Wireshark for DataHub troubleshooting:
Disable all connections except the one that is having trouble.
Configure an unencrypted connection, since Wireshark cannot normally decode an SSL stream. For OPC UA, use the
opc.tcpprotocol with security policyNoneand user token typeAnonymous.Start Wireshark and start the Event Log logging to a file with all options on.
Perform any actions that demonstrate the problem, making a note of the clock time.
Stop the Wireshark log, and stop the Event Log logging to a file.
Uncheck the Debug option in the Event Log.
Zip and send both Wireshark trace, DataHub log, and clock time of the problem demonstration to
[email protected].