14.2. Connecting
All scenarios for the DataHub External Historian begin with a connection from a DataHub instance to a historian. Here's how to configure a connection.

Preliminaries
Ensure that the DataHub program is installed and running.
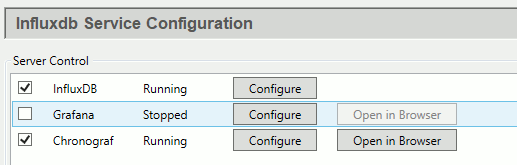
In the DataHub Properties window, go to the InfluxDB option
 and check the boxes for InfluxDB and Chronograf, and click
.
and check the boxes for InfluxDB and Chronograf, and click
.
![[Note]](images/note_1156523861.png)
The online product documentation for InfluxDB and Chronograf can be found here.
Start DataPid, and check the Data Browser to ensure that its data is updating.
External Historian
In the DataHub External Historian option
 click the button.
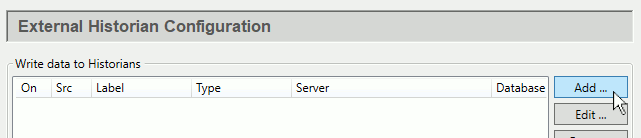
In the Edit Historian Connection window, configure a local InfluxDB connection as follows:
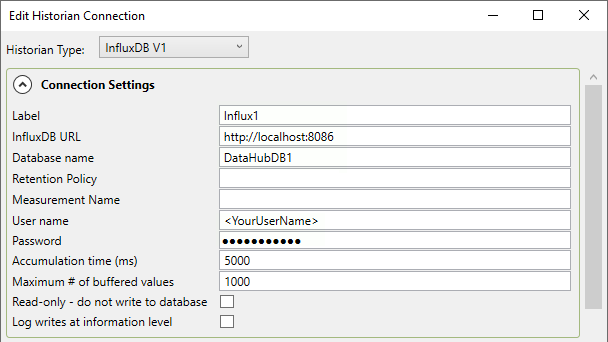
If you don't have a user name or password for InfluxDB, you can leave those fields blank. If you have previously installed InfluxDB independently of the DataHub program installation, then you'll need to use your existing InfluxDB URL.
In Available Points select just the
Mvpoint in theDataPiddomain, underPID1. You can add more points later, if you'd like.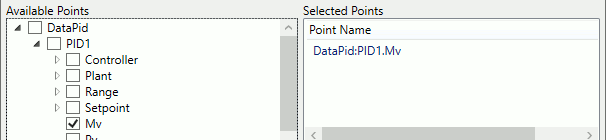
The point
DataPid:PID1.Mvwill appear in Selected Points.When finished, click and . You have now created an InfluxDB database and are collecting a history of values for the
DataPid:PID1.Mvpoint.
Checking Updates
It is possible to check updates using the DataHub Event Log.
Select your connection in the Write data to Historians list and click the button to open it.
In the Connection Settings, check the box, and click and .

If this box is not checked, this information is only displayed in the Event Log when its option is selected.
Open the Event Log to view data updates.

Check Chronograf
You can check Chronograf to view updates to the InfluxDB database.
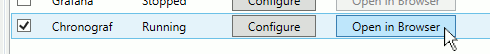
In the InfluxDB option, ensure that both InfluxDB and Chronograf are running, and click the Chronograf button.
Go to Dashboards and click , then .
Choose DataHubDB1.Influx1, in DataPoints choose pointname then PID1.Mv.

Under Fields select value.
You should start to see some data appear in the trend at the top of the display. You can change the dashboard name from
Untitled GraphtoSource (DH1) Logged to Influx1, and click the green checkbox to save the dashboard.
Please refer to the Chronograf documentation for more details.
Adding Points
You can add more points by simply adding them to the External Historian configuration.
Select your connection in the Write data to Historians list and click the button to open it.
In Available points select more points, such as
DataPid:PID1.PvandDataPid:PID1.Sp.When finished, click and . You are now collecting historical data on these points as well.
You can check your results in Chronograf. You will need to reconfigure the graph by selecting the two additional points, and turning on the option.
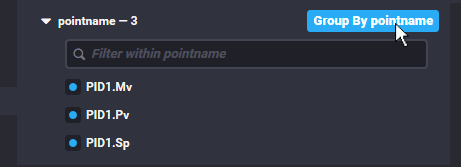
There should now be three trend lines in each display.
