3.20. System Monitor

|
The System Monitor option allows you to access any system performance data item, such as CPU usage, memory usage, process ID, disk space, network traffic, etc. with the DataHub program. |
For example, by monitoring process ID you could determine whether a particular process is running or not. Any information accessed here becomes part of the DataHub data set, and can thus be tunneled across the network, used in scripts or as email triggers, viewed in a spreadsheet, stored in a database, etc.

To enable system monitoring, check the box. There are several configuration options.
- Data Domain:
The name of any DataHub data domain. The values retrieved from the system will be shown as points in this data domain.
- Update Rate:
The frequency that the system is polled and all selected points are updated. The minimum polling time is 100 ms., so the value entered here cannot be less than
100.![[Note]](images/note_1156523861.png)
A high update rate (a low number here) for many data points could use a great deal of CPU.
When a parameter is invalid
A parameter will be invalid if the object being monitored is not available. For
example, if a process is not running then the parameters for that process will all
be invalid. This is a useful way to monitor a system process or other object. For
example, you could use a script or other client to watch a process ID, and when the
process ID becomes -1 you could generate an alarm indicating that
the process is no longer running.
Point Names
The System Monitor automatically creates DataHub point names based on the names of the system properties. Some client programs cannot work with point names containing special characters. This section allows you to specify which characters will be removed from the property name when constructing the point name.
Monitored system parameters
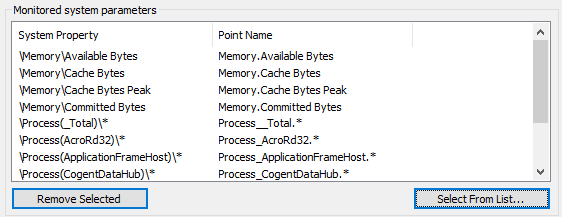
This list shows the system properties you have chosen, and their corresponding point names in the DataHub instance. To add names to the list, click the button. This will open the Select System Properties dialog:
| |
Depending on your system, this dialog may take a few seconds to appear. If it does not come up, the Event Log will contain a message. Otherwise, just be patient, it will open eventually. |
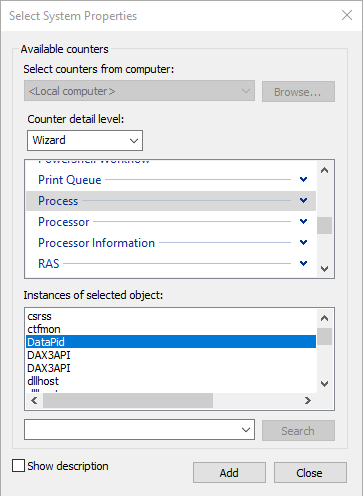
In the Select System Properties dialog you can specify which items to add to your list of monitored system properties, according to these criteria:
Performance object A list of all available objects, such as CPU, Memory, Process, Print Queue, TCP, etc.
Counters All of the available data categories related to the selected performance object. You can choose all counters, or select specific counters from the list. The button opens a window with an explanation of the selected counter.
Instances All of the instances of the chosen performance object. For example, if you chose Process for your performance, this list will show all of the processes running on your system. You can choose all processes or select specific processes from the list.
A number in this list normally indicates a selection from multiple objects of a given type, and
_Totalmeans the total across all of the objects. For example, if you are looking atProcessorin a multi-processor machine, you will see a number (0,1, etc.) for each processor and a_Totalfor the cumulative statistic over all processors.
Select a performance object, and counters and instances as applicable.
Click the button to add the selected items to the Monitor system parameter list in the DataHub Properties window.
Click the or button in the Properties window when you are finished making your choices and filling the list, to apply your changes. You should be able to view the results in the Data Browser.
If you change your mind on what points to monitor, you can change the list at any time. Any points you remove from the list will continue to exist in the DataHub instance until it is shut down and restarted. Please refer to Section 21.1, “Data Points” for more information on creating and deleting points.